PID online simulator
Ideal PID values
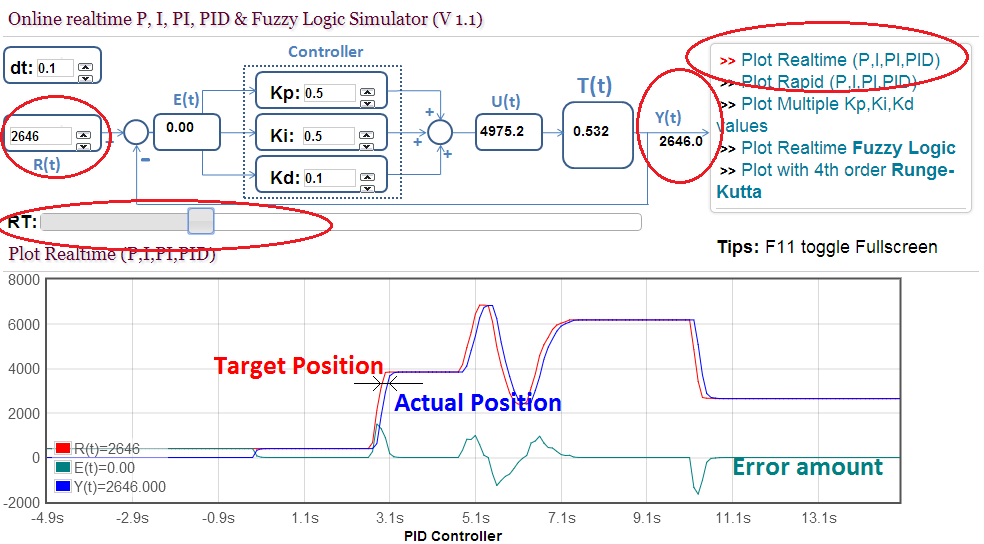
You can plan with the characteristics of an PID control loop yourself using this online-simulator here. First click on the "Plot Realtime" button and now you can play with the input value R(t) by moving the slider as if you would tell our gimbal to move to a new target position. In the diagram the red line shows your value R(t), the target value, and the blue line is the actual position. With the initial values for PID there is a short delay but the target value is reached quickly and without overshooting it. Nice.
D-parameter too high
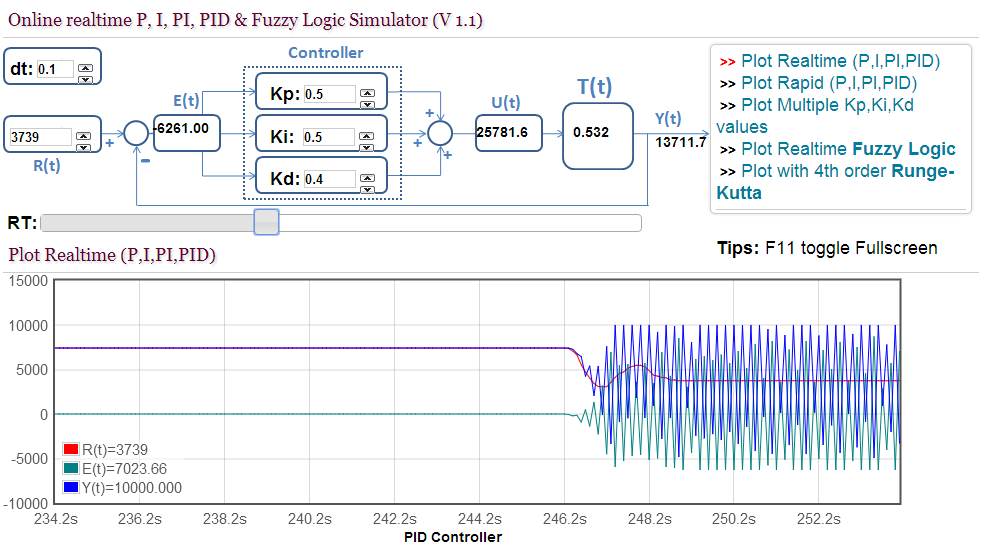
Now increase D to 0.2, same behavior. When D=0.3 there are some oscillations in the diagram but the target value is reached after 5 seconds. Now increase D to 0.4. At first nothing does happen as there is no or almost no error. But even the slightest change kicks the logic into maximum oscillations that will never stop. That is the reason why we need to tune the parameters not only from a static position, but also while oscillating already and in all different positions.
P-parameter too high
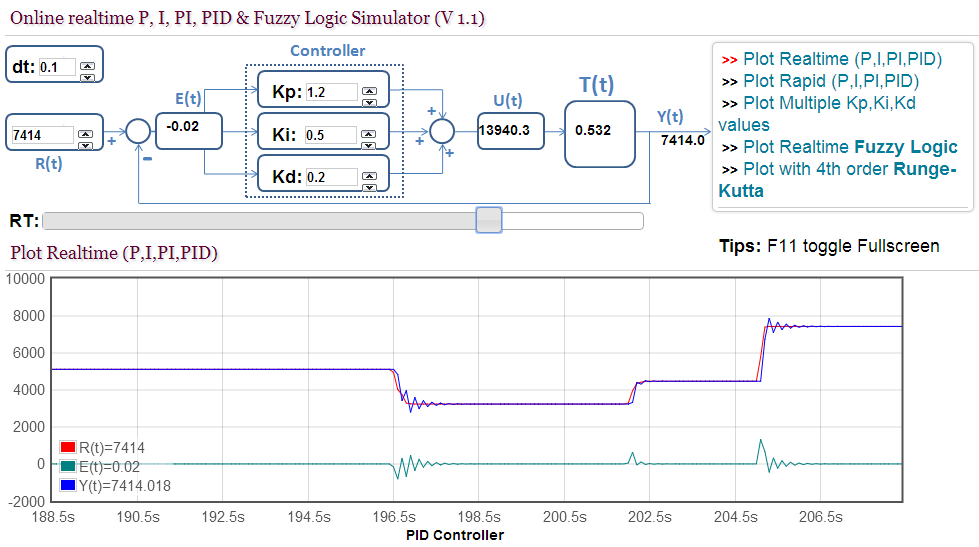
Same behavior you will find when the P or I part gets too high. At P=1.2 I=0.5 and D=0.2 and changing the input value R(t) with the slider shows that the target value is reached quickly but with first oscillations already. Increasing P to 1.5 and it takes ages already until the target value is reached.
I-Parameter too high
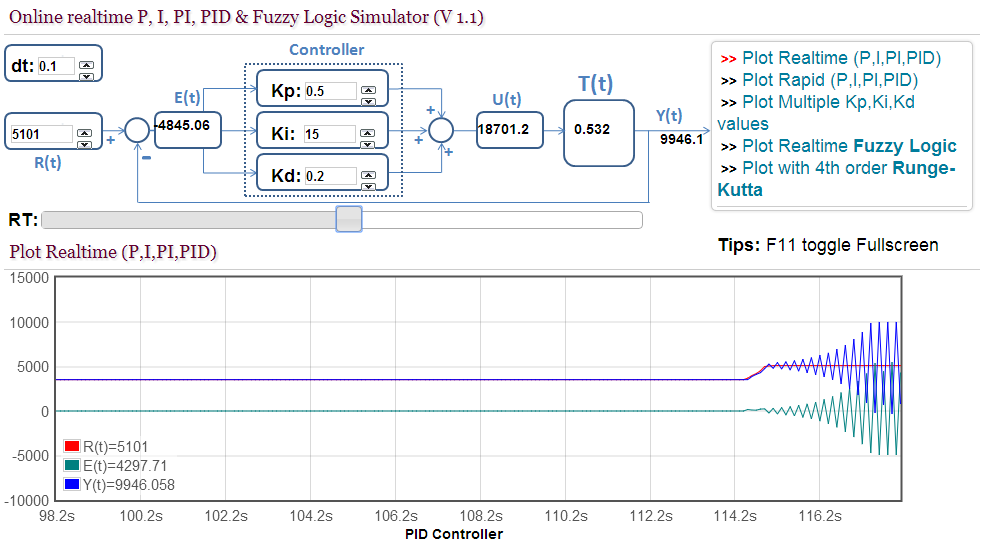
And at I=15 (P=0.5; D=0.2) the target position is never reached again.


